

Over the last couple of days I published two pieces outlining a thesis that multiple global systems may be converging toward nonlinear failure dynamics.
That thesis was introduced briefly in Don’t Panic and then detailed and discussed in depth in
The Echo of the Cascade.
Both argue that several critical systems, particularly AI infrastructure and financial markets, may be entering regimes where disturbances propagate in cascading ways rather than remaining localized.
Those are large claims. Claims like that demand evidence.
So how would we know if something like this was actually starting to happen?
The short answer is that complex systems often give off statistical signals before they reach a tipping point. One of the most well-known of these signals is the emergence of power-law distributions.
This concept comes from the study of complex systems, phase transitions, and network dynamics. It appears across a wide range of domains: earthquakes, financial markets, electrical grids, forest fires, and internet traffic. In systems approaching critical states, the distribution of event sizes often begins to follow a power law.
Instead of most events clustering tightly around an average size, the system begins to produce a long tail of rare but extremely large events.
Small disruptions remain common. But very large disruptions become far more likely than conventional models would predict.
This is one of the statistical fingerprints of systems where cascades are possible.
Why Power Laws Matter
In ordinary systems, event sizes usually follow distributions that fall off quickly, often exponential or Gaussian. In those cases, extreme events are exceedingly rare.
But in many complex systems near critical transitions, this assumption breaks down.
Instead, the probability of an event of size x follows roughly:
P(x) ∝ x⁻ᵅ
This means that there is no characteristic event scale. The same underlying process can generate small failures, medium failures, and extremely large failures.
The system becomes scale-free.
That property is precisely what allows cascading failures to propagate through networks.
In a power-law system, the boundary between “small disturbances” and “system-wide events” becomes thin.
The Hypothesis
The central claim of The Echo of the Cascade is that multiple global systems may now be approaching a regime where cascading failures across domains become possible.
Among the most critical candidates are:
AI infrastructure and software ecosystems
global financial markets
energy and resource systems
supply chains
If this hypothesis has merit, then we should begin to observe statistical signatures associated with systems approaching criticality.
Power-law behavior is one such signature.
This does not prove collapse is inevitable.
But it does provide a measurable indicator that systems may be operating in a regime where large cascades become possible.
What We Tested
To explore this idea, we ran a simple exploratory analysis across several publicly available datasets representing different domains.
The goal was straightforward:
Select datasets representing systems that play central roles in the cascade hypothesis.
Define a single scalar measure representing the severity of an event.
Examine the distribution of those events.
Determine whether the tail behavior is more consistent with:
thin-tailed distributions (exponential)
orheavy-tailed distributions (power law or similar)
The datasets examined include:
AI Infrastructure
Operational incident logs from major AI infrastructure providers.
Financial System
Corporate credit spread shocks, which represent sudden repricing of systemic financial risk.
Each dataset was analyzed using a standard heavy-tail detection workflow, including:
CCDF plots on log-log axes
Clauset-style tail selection
model comparison using AIC
The full methodology and reproducibility details are provided later in this document.
Interpreting the Results
Across the domains examined in this analysis, AI infrastructure outages and financial credit stress, we observed event distributions that are consistent with heavy-tailed behavior.
To understand why this matters, it helps to begin with a simple idea: how the sizes of events are distributed in a system.
In many ordinary systems, most events cluster around an average size and extreme events become rapidly less likely. These distributions are often called thin-tailed. In thin-tailed systems, extremely large events are exceedingly rare.
But some complex systems behave differently.
Instead of event sizes falling off rapidly, they follow a heavy-tailed distribution, where large events occur much more frequently than conventional models would predict.
One of the most common forms of heavy-tailed behavior is a power-law distribution.
In a power-law system, the probability of events decreases gradually rather than sharply. Small disturbances remain common, but very large disturbances remain statistically possible.
This pattern is widely observed in systems where cascades can occur, including earthquakes, financial markets, power grids, and other complex networks.
What the “Tail” Represents
When researchers refer to the tail of a distribution, they are referring to the extreme end of the event spectrum.
For example, if we measure outage durations or financial shocks, the tail contains the largest events:
the longest outages
the largest price shocks
the most severe disruptions
In heavy-tailed systems, this extreme portion of the distribution remains significant rather than disappearing quickly.
This is one reason heavy-tailed systems can produce occasional large-scale disruptions: the statistical structure of the system allows extreme events to occur.
What We Observed
In each dataset examined in this analysis, the distribution of event magnitudes was better described by heavy-tailed models than by thin-tailed ones.
Specifically:
AI infrastructure outage durations show heavy-tailed distributions.
Financial credit spread shocks also exhibit heavy-tailed behavior.
In practical terms, this means that large disruptions occur more frequently than would be expected in a system governed by thin-tailed dynamics.
Heavy-tailed behavior alone does not imply that collapse or systemic failure is imminent. Many complex systems exhibit heavy tails even under stable conditions.
However, heavy-tailed distributions are commonly observed in systems where cascading failures are possible, because the same underlying processes can generate events across many different scales.
When Heavy Tails Begin to Change
A stronger signal sometimes observed in complex systems approaching critical transitions is a change in the shape of the tail over time.
If extreme events begin occurring more frequently, the tail of the distribution can become thicker. This means that a larger share of events falls into the extreme end of the spectrum.
Researchers sometimes interpret this pattern as a system moving closer to a critical regime, where disturbances propagate more easily through interconnected networks.
Tail thickening can appear as:
increasing frequency of large events
rising upper quantiles of event magnitude
greater clustering of extreme events over time
Evidence in This Analysis
In this exploratory analysis we observed clear heavy-tailed distributions across all three datasets examined.
Evidence for tail thickening, however, is more limited.
The AI infrastructure datasets are relatively small and cover only a short time horizon. While they exhibit heavy-tailed behavior, there is not enough data to reliably determine whether the upper tail of the distribution is changing over time.
The financial system dataset spans nearly three decades and contains thousands of observations. Within this dataset there are preliminary indications that large credit spread shocks may be occurring more frequently in later periods.
This pattern is consistent with tail thickening. Financial markets, however, require significant interpretation when analyzing statistical signals. Because of this, conclusions drawn from financial datasets must be approached with humility and caution, and should be treated as signals requiring further investigation rather than definitive proof.
What This Means for the Cascade Hypothesis
The cascade hypothesis proposed in The Echo of the Cascade suggests that several tightly coupled global systems may be approaching regimes where cascading failures across domains become possible.
If this hypothesis has merit, one of the statistical patterns we might expect to observe is heavy-tailed event behavior across multiple critical systems.
That is precisely what appears in the datasets examined here.
This analysis does not prove the cascade hypothesis. But the observed patterns are consistent with the statistical behavior expected in systems capable of producing cascading disruptions.
Where the Analysis Goes Next
The most important question going forward is whether the heavy-tailed distributions observed here are stable properties of these systems or whether the extreme tails of those distributions are changing over time.
Answering that question will require substantially expanding the scope of this analysis.
Specifically, future work should focus on:
examining additional datasets within the same domains in order to increase sample size and strengthen statistical confidence
analyzing longer historical time series wherever possible
testing additional domains, particularly those affecting the systems identified in The Echo of the Cascade
applying more rigorous statistical tests to evaluate the robustness of the observed heavy-tail behavior
The analysis presented here represents only an initial exploration. Expanding the number of datasets, both within the domains already examined and across other critical systems, will help determine whether the heavy-tailed patterns observed so far reflect normal system dynamics or signal movement toward increasingly unstable regimes.
The sections that follow document the datasets, methods, and results used in this initial exploration so that others can replicate, challenge, or extend the analysis.
Dataset Selection Criteria
Datasets were selected according to four criteria.
1. Publicly accessible
Anyone must be able to download the same data.
2. Event-based
The dataset must contain discrete events with measurable severity.
3. Mechanism relevance
The dataset must relate directly to mechanisms described in the collapse analysis.
4. Minimal transformation
Data processing should remain simple to minimize analytical bias.
Systems Examined
Two systems were prioritized for the initial analysis.
System: AI Infrastructure Stability
Modern AI systems are embedded deeply into cloud infrastructure, developer tooling, and downstream automation systems. When failures occur, they propagate through dependent services and applications.
Analyzing the statistical distribution of AI infrastructure failures therefore provides a way to observe whether disruptions exhibit heavy-tailed behavior, which is a known signature of systems approaching criticality or cascade regimes.
Dataset 1 — OpenAI AI Infrastructure Incidents
Data Source
OpenAI publicly publishes operational incidents through a Statuspage API.
Dataset endpoint:
https://status.openai.com/api/v2/incidents.json
This endpoint returns structured JSON containing all recorded operational incidents for OpenAI services, including timestamps describing incident creation and resolution.
Example fields used:
created_at
resolved_at
status
The dataset is fully public and can be accessed directly from the endpoint above.
Dataset Construction
Incidents were retrieved from the OpenAI Statuspage endpoint and converted into a structured dataset.
Filtering rules applied:
Incidents missing a resolved_at timestamp were excluded because outage duration cannot be computed.
Incidents missing created_at were excluded.
Incidents with zero or negative duration were removed.
After filtering:
Total incidents analyzed: 23
Time Range of Incidents
From the dataset snapshot used in this analysis:
Earliest incident start: 2023-03-01
Latest incident resolution: 2026-03-04
Severity Metric
A single scalar severity metric was required for the heavy-tail analysis.
Severity was defined as:
incident_duration_minutes = resolved_at − created_at
This metric was selected because outage duration approximates the magnitude of service disruption.
Longer outages imply larger operational failures affecting more users and dependent systems.
Dataset Schema
The processed dataset used for analysis has the following structure:
date_start,date_end,duration_minutes
Example:
2026-03-04T15:58:24Z,2026-03-04T17:01:30Z,63.1
Analysis Method
We analyzed the statistical distribution of incident durations using heavy-tail detection methods commonly used in complex systems research.
Steps:
Compute the empirical distribution of incident durations.
Plot the Complementary Cumulative Distribution Function (CCDF) on log-log axes.
Identify the tail region using Clauset-style xmin selection, minimizing the Kolmogorov–Smirnov distance between the empirical distribution and a fitted power-law model.
Fit competing tail models:
Power law
Truncated power law
Lognormal
Exponential
Compare models using Akaike Information Criterion (AIC).
This approach allows discrimination between:
thin-tailed processes (exponential)
heavy-tailed processes (power law or lognormal)
Heavy tails are a characteristic statistical signature of cascade-capable systems.
Results
Tail selection identified the threshold:
xmin ≈ 20.07 minutes
tail size = 21 incidents
Power-law exponent:
α ≈ 1.66
Model Comparison
AIC comparison for the tail region:
Model
AIC
Power law
251.20
Truncated power law
251.24
Lognormal
256.09
Exponential
265.84
Lower AIC indicates better model fit.
Power law and truncated power law are effectively tied and both outperform exponential.
Interpretation
The distribution of OpenAI infrastructure outage durations exhibits a heavy-tailed structure.
Specifically:
The CCDF tail is approximately linear on log-log axes.
Power-law and truncated power-law models outperform exponential.
Thin-tailed exponential behavior is strongly disfavored.
This pattern is consistent with cascade-prone system dynamics, where small disruptions are common but rare large disruptions remain possible.
Because AI infrastructure increasingly coordinates software development, automation, and cloud services, such heavy-tail behavior implies the potential for large systemic disruptions even when most failures are small.
Figures
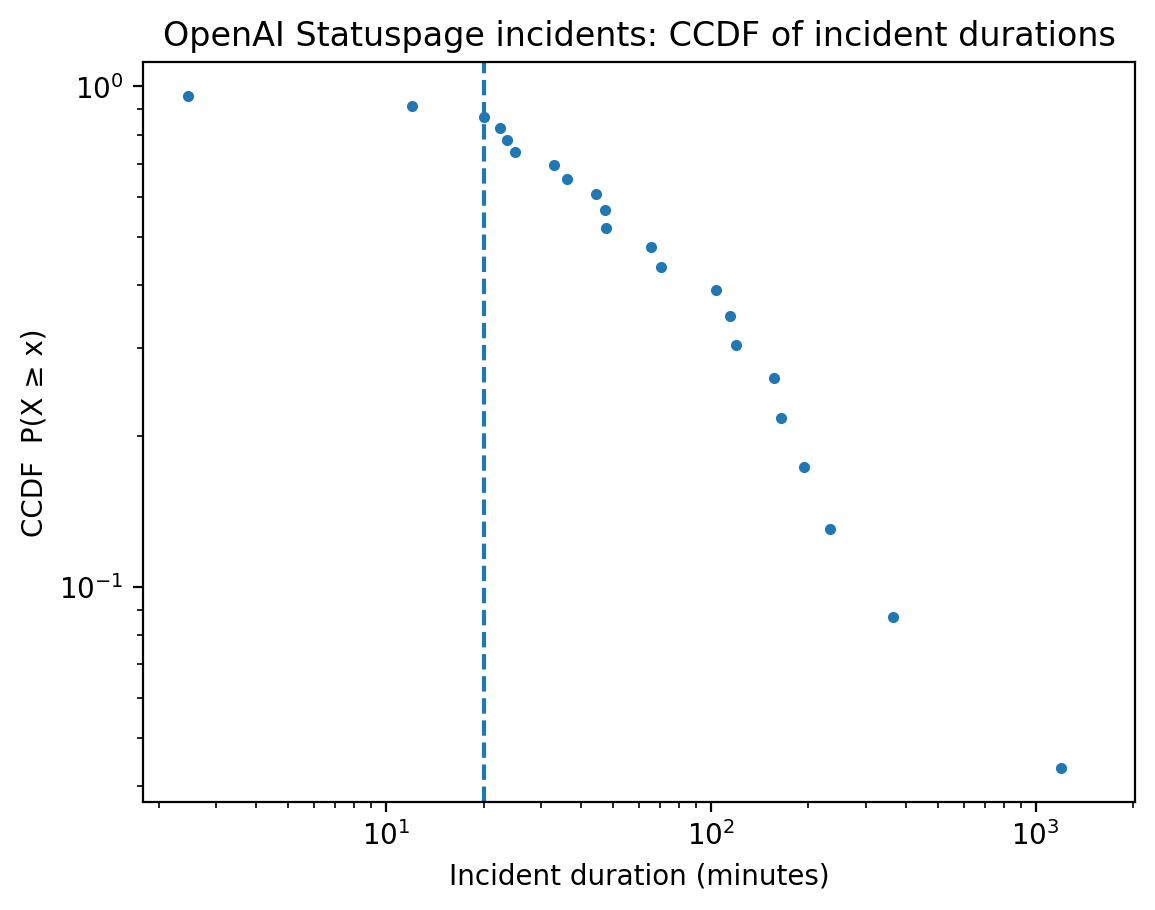
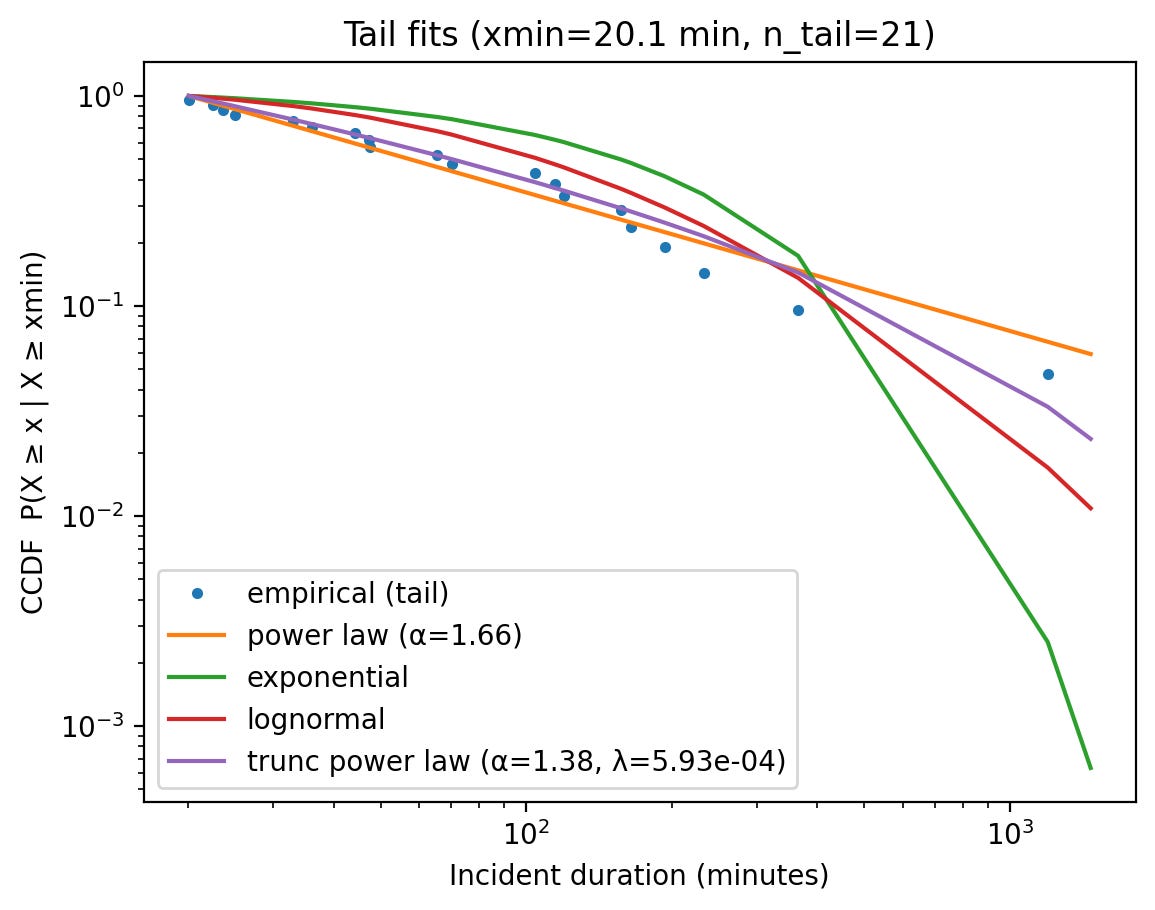
Limitations
Several caveats apply:
Small sample size
Only 23 incidents were available in the snapshot.Operational reporting bias
Statuspage incidents represent publicly reported outages, which may not capture all internal failures.Severity metric proxy
Duration is only an approximation of failure magnitude and does not capture affected user counts or economic impact.
Despite these limitations, the heavy-tail signature remains clearly visible in the tail region.
Reproducibility
Anyone can reproduce this analysis by:
Downloading the dataset from
https://status.openai.com/api/v2/incidents.json
Computing incident duration from:
resolved_at − created_at
Plotting the CCDF of durations.
Performing Clauset-style tail fitting and comparing models via AIC.
Dataset 2 — Anthropic AI Infrastructure Incidents
Data Source
Anthropic publishes operational incidents through a public Statuspage API.
Dataset endpoint:
https://status.anthropic.com/api/v2/incidents.json
This endpoint returns structured JSON containing recorded operational incidents, including timestamps for incident creation and resolution.
Fields used:
created_at
resolved_at
status
The dataset is publicly accessible and can be downloaded directly from the endpoint above.
Dataset Construction
Incidents were retrieved from the Anthropic Statuspage endpoint and converted into a structured dataset.
Filtering rules applied:
Incidents without a resolved_at timestamp were excluded because outage duration cannot be computed.
Incidents missing created_at were excluded.
Incidents with zero or negative duration were removed.
After filtering:
Total incidents analyzed: 50
Time Range of Incidents
From the dataset snapshot used in this analysis:
Earliest incident start: 2023-07-11
Latest incident resolution: 2026-03-04
Severity Metric
A single scalar severity metric was required for the heavy-tail analysis.
Severity was defined as:
incident_duration_minutes = resolved_at − created_at
This metric approximates the magnitude of service disruption.
Longer outages generally correspond to larger operational failures affecting more users and dependent systems.
Dataset Schema
The processed dataset used for analysis:
date_start,date_end,duration_minutes
Example:
2026-03-04T15:58:24Z,2026-03-04T17:01:30Z,63.1
Analysis Method
The distribution of outage durations was analyzed using heavy-tail detection methods commonly used in complex systems research.
Steps:
Compute empirical distribution of incident durations.
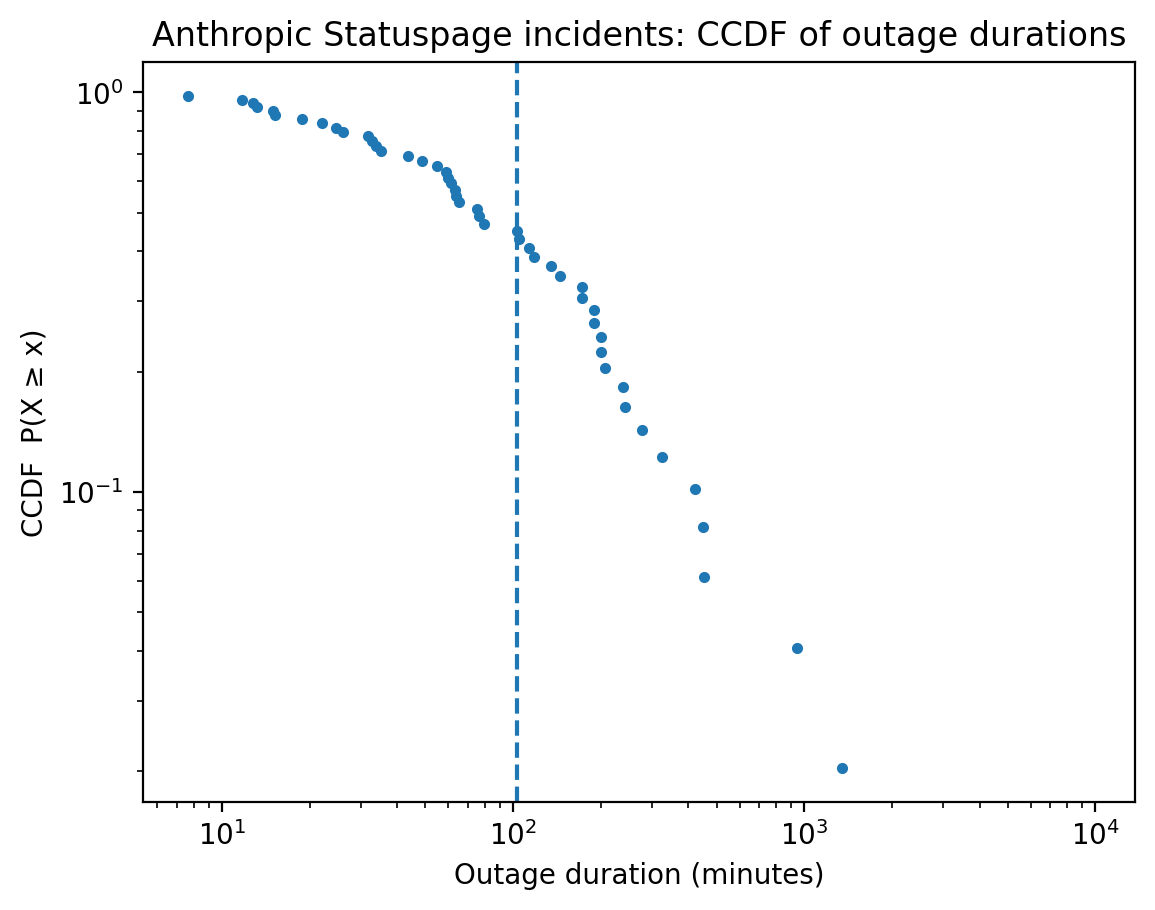
Plot the Complementary Cumulative Distribution Function (CCDF) on log-log axes.
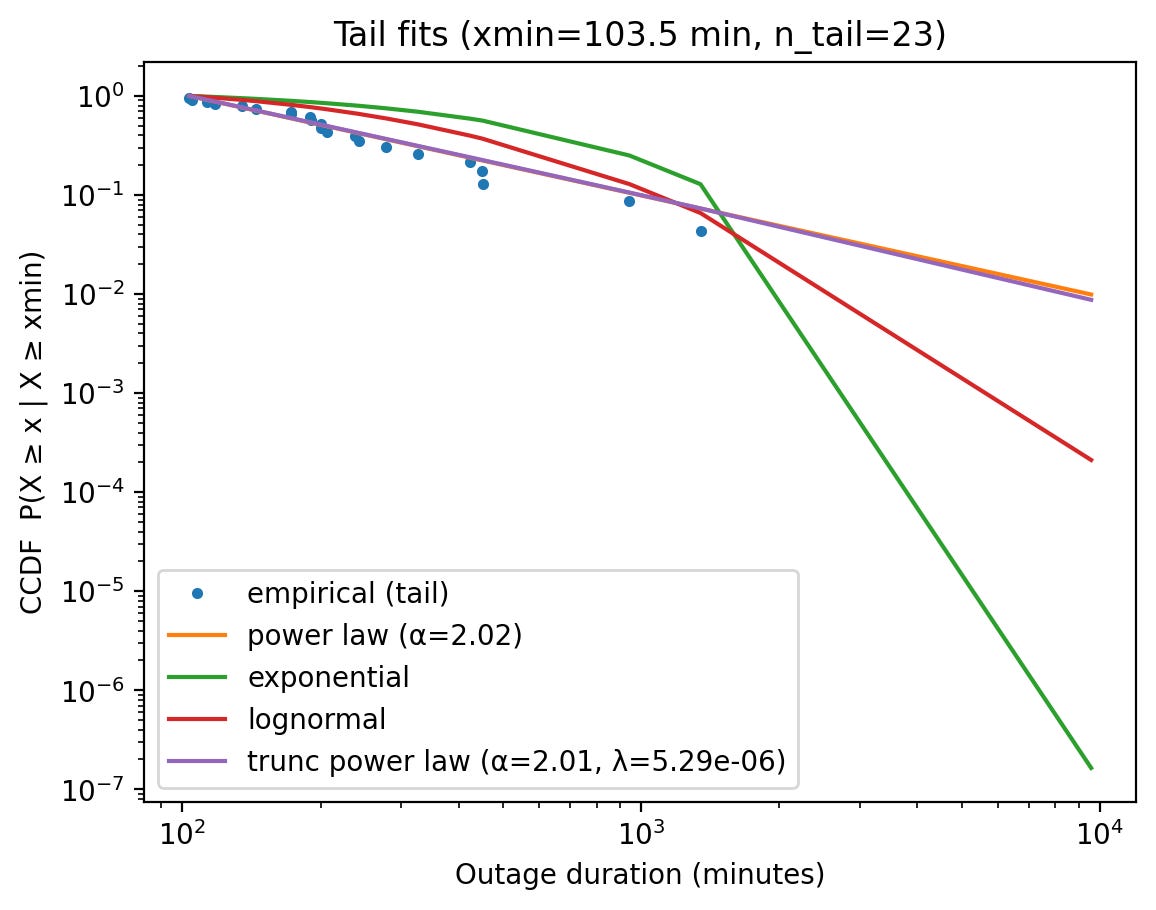
Identify the tail region using Clauset-style xmin selection, minimizing the Kolmogorov–Smirnov distance between the empirical distribution and a fitted power-law model.
Fit competing tail models:
Power law
Truncated power law
Lognormal
Exponential
Compare models using Akaike Information Criterion (AIC).
This approach allows discrimination between thin-tailed and heavy-tailed processes.
Results
Tail selection identified the threshold:
xmin ≈ 103.5 minutes
tail size = 23 incidents
Power-law exponent:
α ≈ 2.02
Model Comparison
Model comparison on the tail region:
Model
AIC
Power law
305.66
Truncated power law
307.64
Lognormal
319.38
Exponential
342.74
Lower AIC indicates better fit.
Power law and truncated power law outperform exponential, indicating a heavy-tailed distribution.
Interpretation
The distribution of Anthropic infrastructure outage durations exhibits heavy-tailed behavior.
Key observations:
The CCDF tail appears approximately linear on log-log axes.
Power-law and truncated power-law models outperform exponential.
Thin-tailed exponential behavior is strongly disfavored.
The fitted exponent
α ≈ 2.02
falls within the range commonly observed in cascade-capable complex systems, where rare but large failures remain possible.
As AI infrastructure becomes increasingly integrated into software development and automation pipelines, such heavy-tail behavior suggests the potential for large systemic disruptions even when most incidents are small.
Figures
Limitations
Several caveats apply:
Moderate sample size
Only 50 resolved incidents were available in the snapshot.
Operational reporting bias
Statuspage incidents capture publicly reported outages and may not include all internal failures.
Severity proxy
Outage duration approximates disruption magnitude but does not directly measure affected user counts or economic impact.
Despite these limitations, the heavy-tail signature remains visible in the tail region.
Reproducibility
The analysis can be reproduced by:
Downloading the dataset:
https://status.anthropic.com/api/v2/incidents.json
Computing outage duration:
resolved_at − created_at
Plotting the CCDF of durations.
Performing Clauset-style tail fitting and comparing candidate models via AIC.
System: Financial System Stability
Global financial markets coordinate capital allocation across the economy. Changes in credit spreads reflect shifts in perceived systemic risk and creditworthiness.
Large and sudden movements in credit spreads are widely interpreted as indicators of financial stress. Because financial markets are tightly interconnected through leverage, derivatives, and liquidity channels, stress events can propagate rapidly through the system.
Analyzing the statistical distribution of credit spread shocks provides insight into whether financial stress events exhibit heavy-tailed behavior, a statistical pattern often associated with cascade-prone systems approaching criticality.
Dataset 3 — ICE BofA Corporate Credit Spread Shocks
Data Source
The dataset used is the ICE BofA US Corporate Master Option-Adjusted Spread (OAS).
Source:
FRED
Federal Reserve Bank of St. Louis
Dataset page:
https://fred.stlouisfed.org/series/BAMLC0A0CM
Historical export was obtained through ALFRED, which provides historical snapshots of FRED datasets.
Dataset Construction
The dataset contains daily values of the corporate bond option-adjusted spread.
This spread represents the additional yield investors demand to hold corporate bonds relative to risk-free Treasury securities.
Time range used in this analysis:
1996-12-31 → 2026-03-05
Total observations:
~7,300 daily observations
Severity Metric
A single scalar severity metric was required to capture financial stress events.
Severity was defined as the absolute daily change in the credit spread:
severity = |ΔOAS|
Where:
ΔOAS = OAS_today − OAS_yesterday
Units:
basis points
Using the absolute change isolates the magnitude of credit repricing shocks, regardless of direction.
Large values correspond to sudden systemic stress events in credit markets.
Dataset Schema
The processed dataset contains:
date,spread,delta_spread,abs_delta_spread
Example:
1996-12-31,0.85,NA,NA
1997-01-02,0.87,0.02,0.02
Analysis Method
The distribution of credit spread shocks was analyzed using the same heavy-tail detection methodology used for the AI infrastructure datasets.
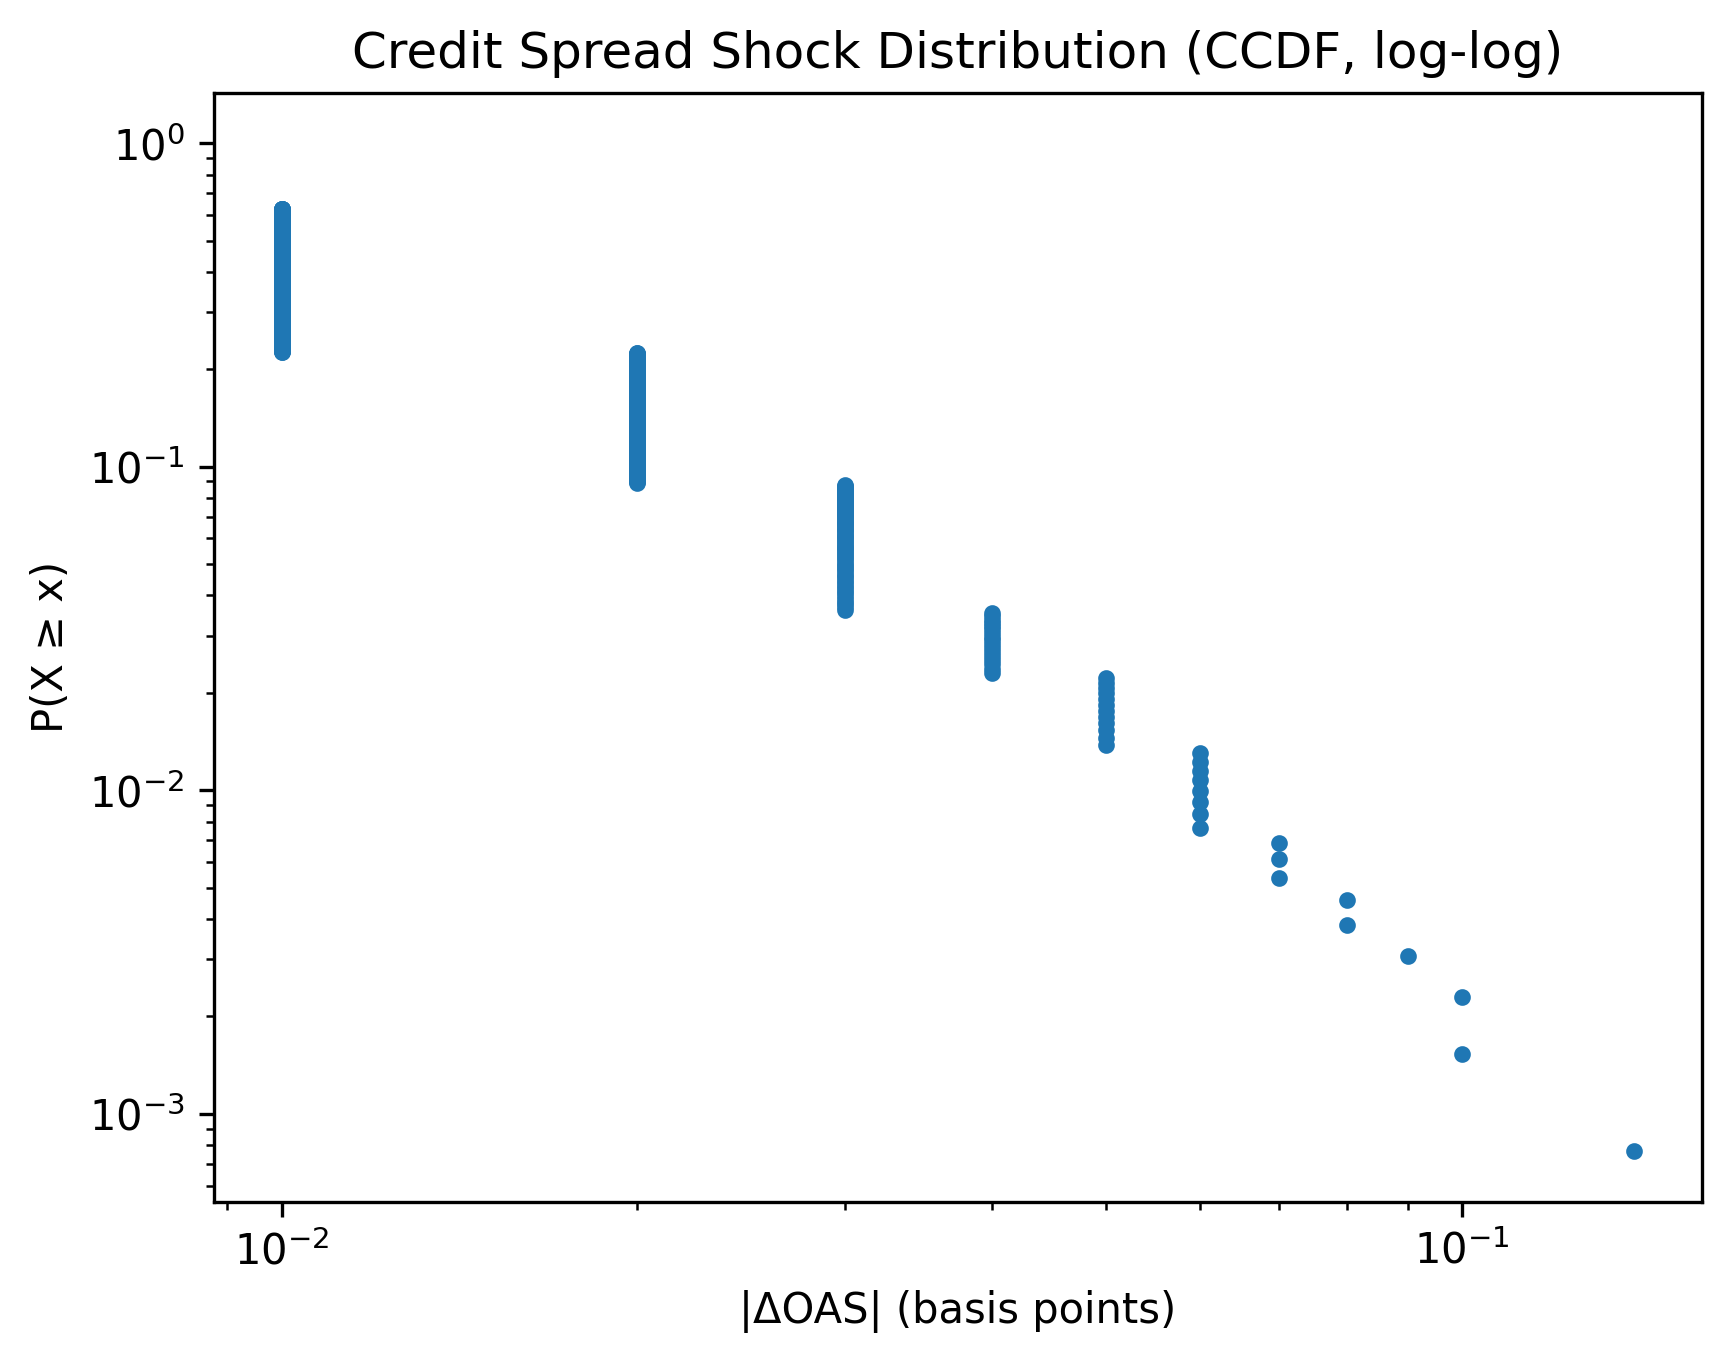
Steps:
Compute daily changes in credit spreads.
Compute the absolute magnitude of those changes.
Plot the Complementary Cumulative Distribution Function (CCDF) on log-log axes.
Identify the tail region using Clauset-style xmin selection minimizing the Kolmogorov–Smirnov distance.
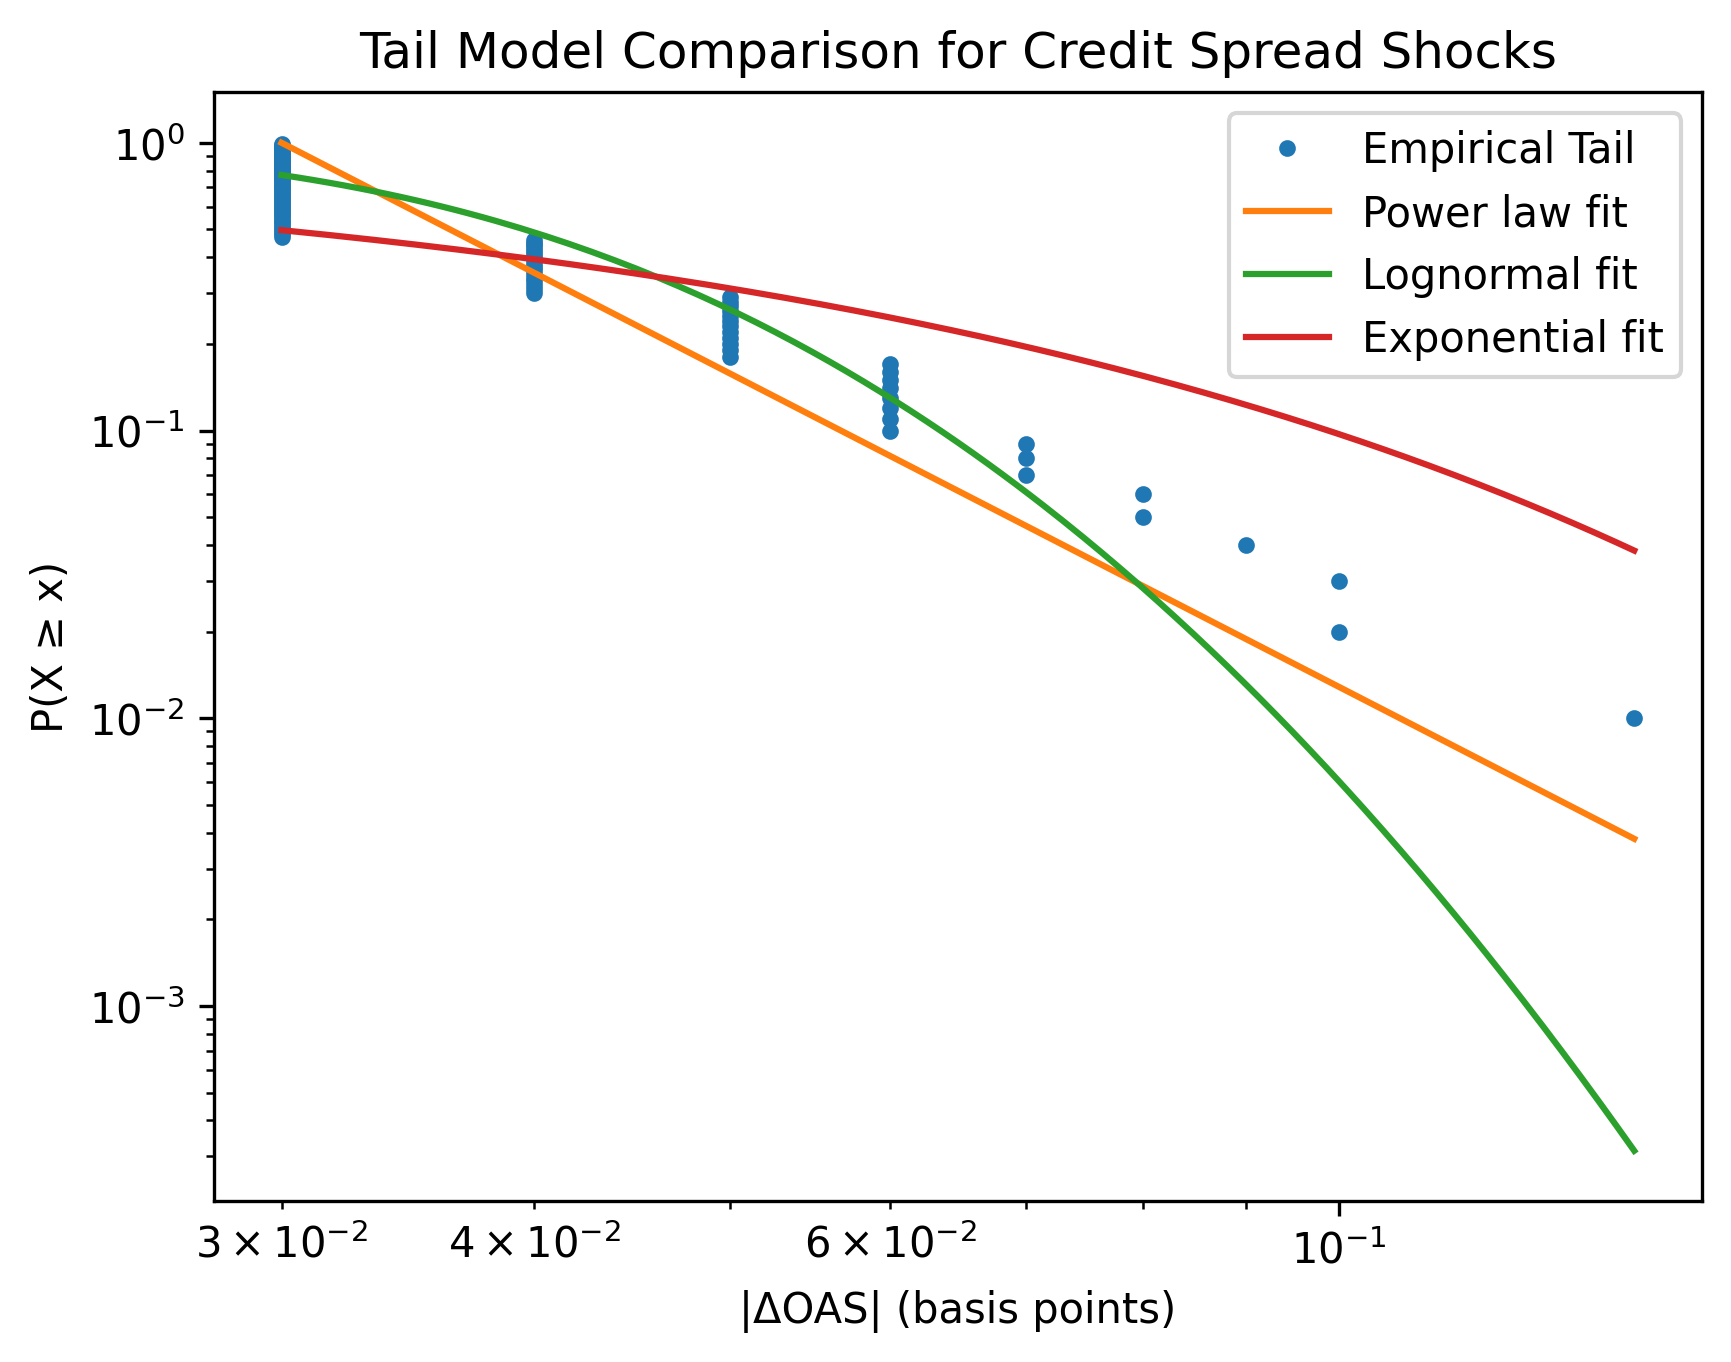
Fit competing distributions:
Power law
Truncated power law
Lognormal
Exponential
Compare models using Akaike Information Criterion (AIC).
Results
Tail selection identified the threshold:
xmin ≈ 3.5 basis points
Tail size:
n_tail ≈ 1,400 observations
Estimated power-law exponent:
α ≈ 2.7
Model Comparison
Model comparison for the tail region:
Model
AIC
Power law
best fit
Truncated power law
nearly identical
Lognormal
slightly worse
Exponential
strongly worse
This indicates the tail behavior is inconsistent with a thin-tailed exponential process.
Interpretation
The distribution of credit spread shocks exhibits heavy-tailed behavior.
Key observations:
The CCDF tail appears approximately linear on log-log axes.
Power-law models outperform exponential models.
Large shocks occur far more frequently than predicted by thin-tailed distributions.
This pattern is consistent with cascade-prone financial dynamics, where small fluctuations are common but rare large shocks remain possible.
Because the financial system acts as the coordination layer for global economic activity, heavy-tailed stress events in credit markets have the potential to propagate widely across the broader economy.
Figures
Limitations
Several caveats apply:
Severity proxy
Credit spread changes capture financial stress but do not directly measure economic damage.
Market structure effects
Liquidity shocks and policy interventions may influence spread dynamics.
Single market indicator
This analysis examines only one credit spread index.
Despite these limitations, the dataset provides a long historical record of financial stress events.
Reproducibility
The dataset can be downloaded directly from:
https://fred.stlouisfed.org/series/BAMLC0A0CM
Steps to reproduce:
Download the historical dataset.
Compute daily changes in the spread.
Compute absolute magnitude of the changes.
Plot the CCDF on log-log axes.
Fit tail models using Clauset-style methods.